
 Vironix Health
· By Botros Toro · Clinical & Research · 4 min read
One Million Blood-Pressure Readings. Here’s What They Revealed.
What one million at-home blood-pressure readings reveal about change over time, seasonal patterns, sustained monitoring, and clinically meaningful risk.
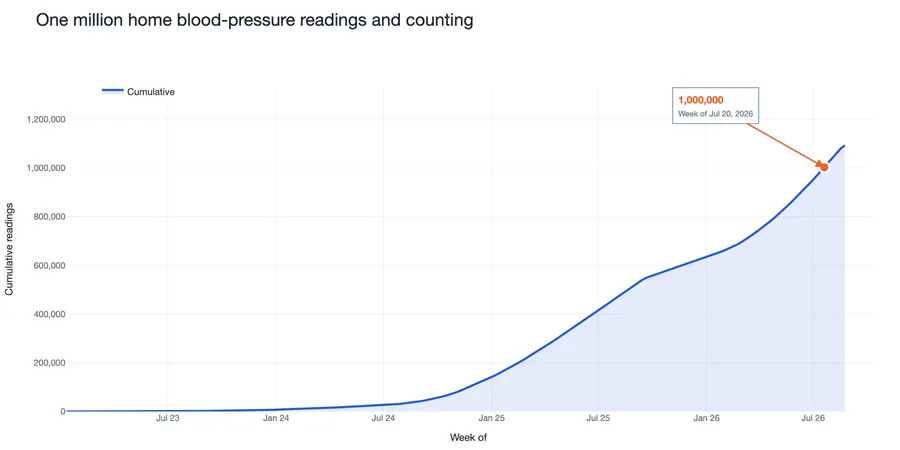
When I get a chance, I like digging through our data. Not just to see if our technology is working, but to understand what our patients are actually experiencing at home. In a recent look through the data, I realized we had quietly crossed one million blood-pressure readings. Every one of those readings came from a patient at home, in the middle of real life. Not in a clinic. Not in a lab. We crossed the line on July 25, 2026, and the count has kept climbing.
Once I saw the number, I wanted to understand what was inside it. What could a million readings teach us about our patients that a single office visit never could? Turns out, quite a lot. I’ll share a small slice here.
Why scale matters: a million readings are more than a milestone
A single blood-pressure reading is a snapshot. Repeated readings reveal the pattern. A million readings let us see the big picture and how each patient's numbers change over time. We can compare readings from earlier and later in care instead of relying only on group averages. The one million figure is the total pool. The examples below use the patients and readings relevant to each question.
What we observed over time in the program
Among 1,173 monitored patients with hypertension who had readings in both earlier and later periods, average home systolic blood pressure fell by 3.8 mmHg. Sixty-three percent had lower average readings in the later period than in the earlier period, and the share at goal (<130/80) rose from 37% to 47%.
That improvement held up under a brutal seasonal check: patients who enrolled in warm months and continued measuring into colder ones, when blood pressure typically rises, still had an average 2.7 mmHg reduction in systolic blood pressure. That's a real change we saw in the same patients over time. It doesn't prove the program caused it.
Using the standard BP goal (<140/90), three out of four monitored patients with hypertension were within the target range.
That matters beyond the number itself: better blood-pressure control is better for patients, and it also connects directly to how physicians and ACOs are measured on patient outcomes, including CMS measures for controlling high blood pressure.
What a million readings reveal beyond the average
Averaging hides as much as it reveals. This is where one million readings become more than a milestone. With this many readings, patterns become easier to see:
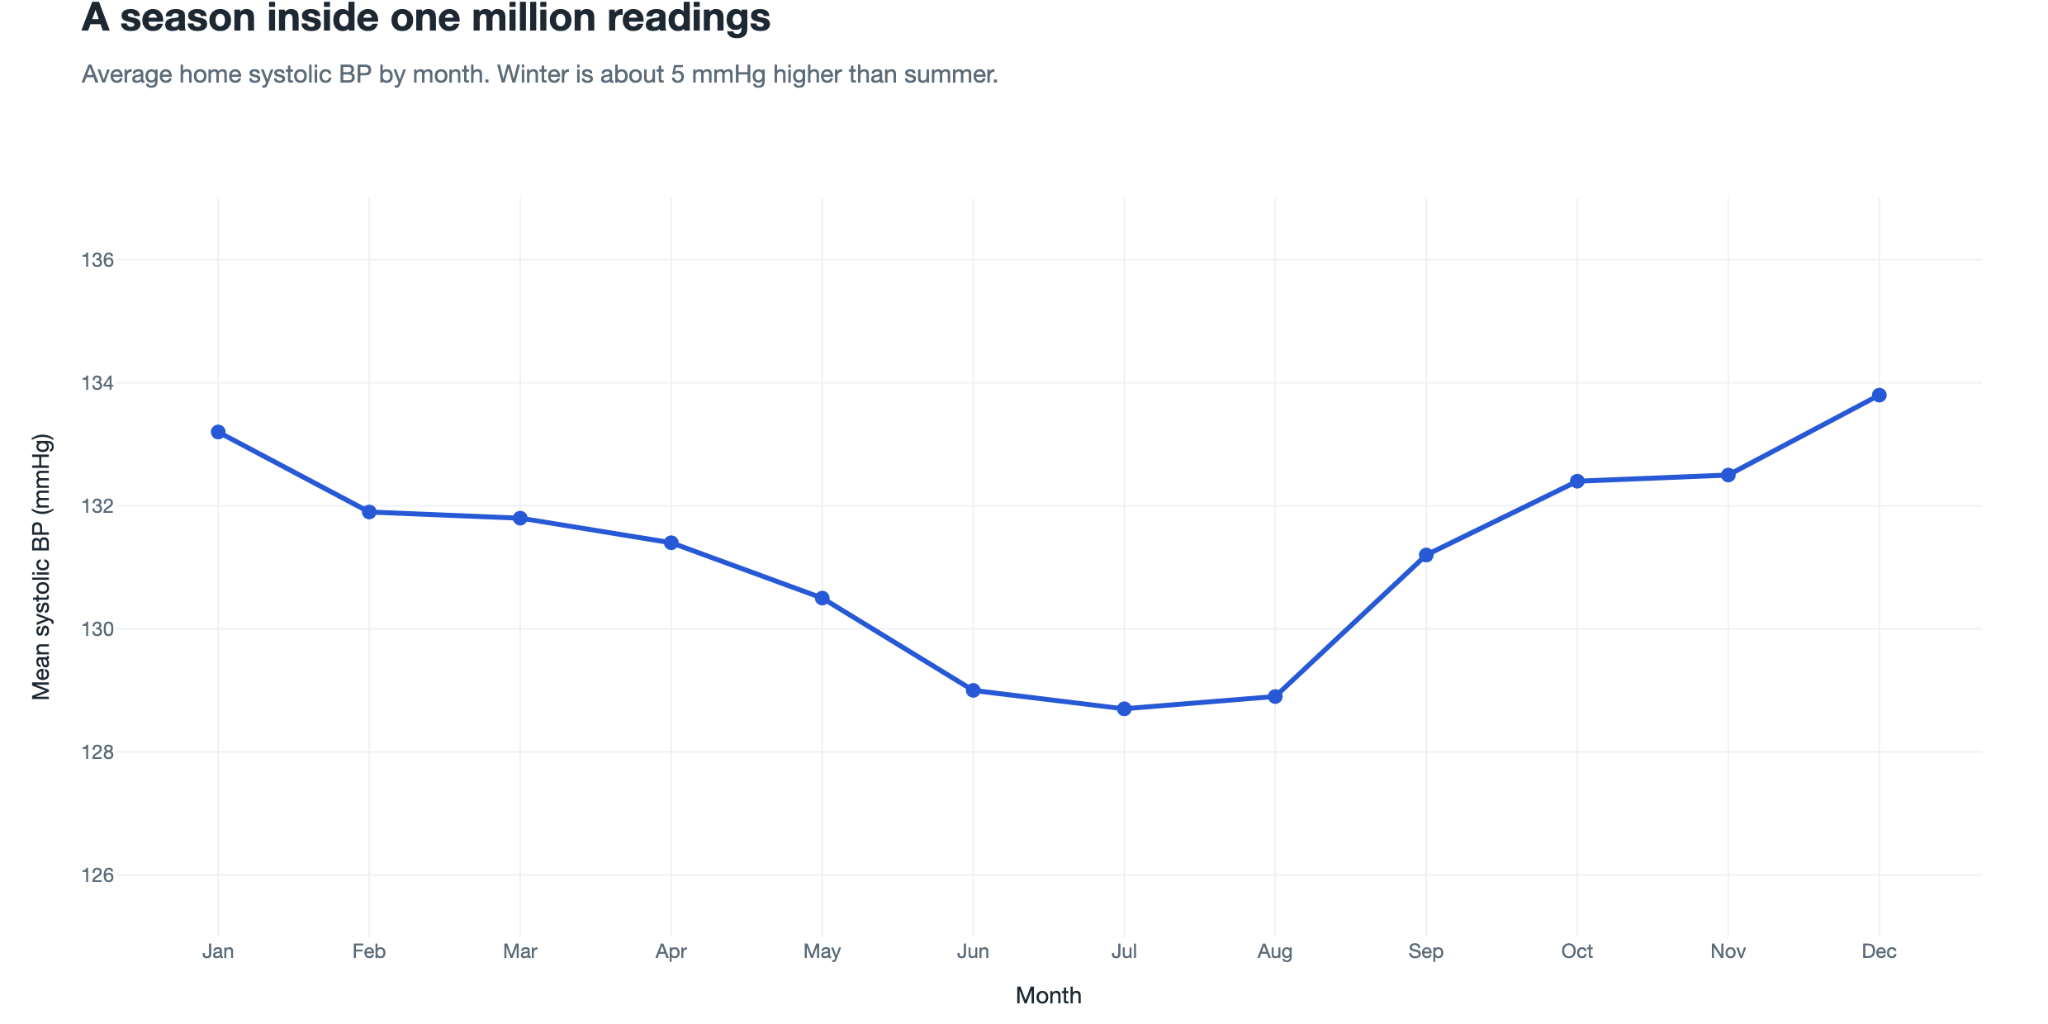
Blood pressure has seasons. Average home systolic blood pressure was 133.8 mmHg in December and 128.7 in July, a difference of about 5 mmHg. Blood pressure tends to rise in cold weather [1], and we can see that pattern in our own data from patients across the country.
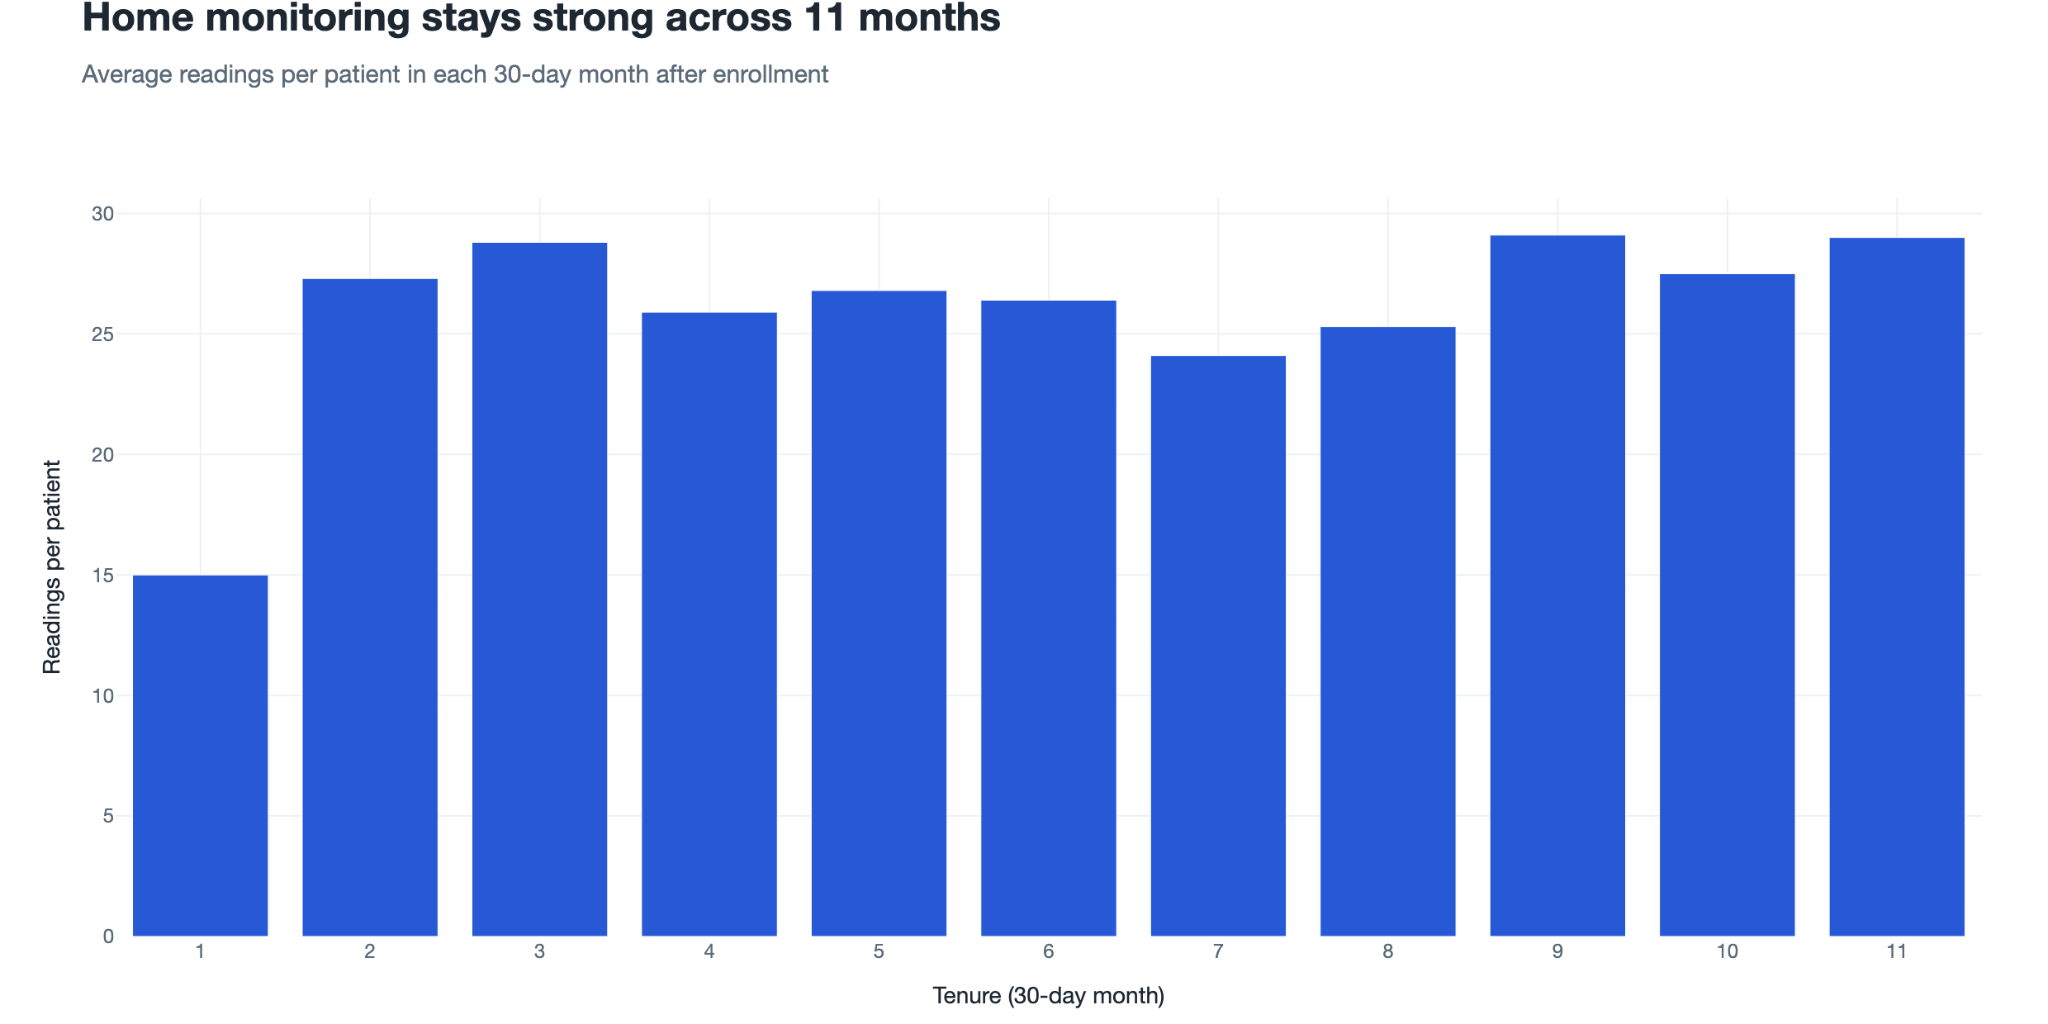
Patients stick with it. Across the first 11 months in the program, patients averaged roughly 15 to 29 readings per month, ranging from about every other day to near-daily monitoring. The median patient logged 90 readings, and some patients logged thousands.
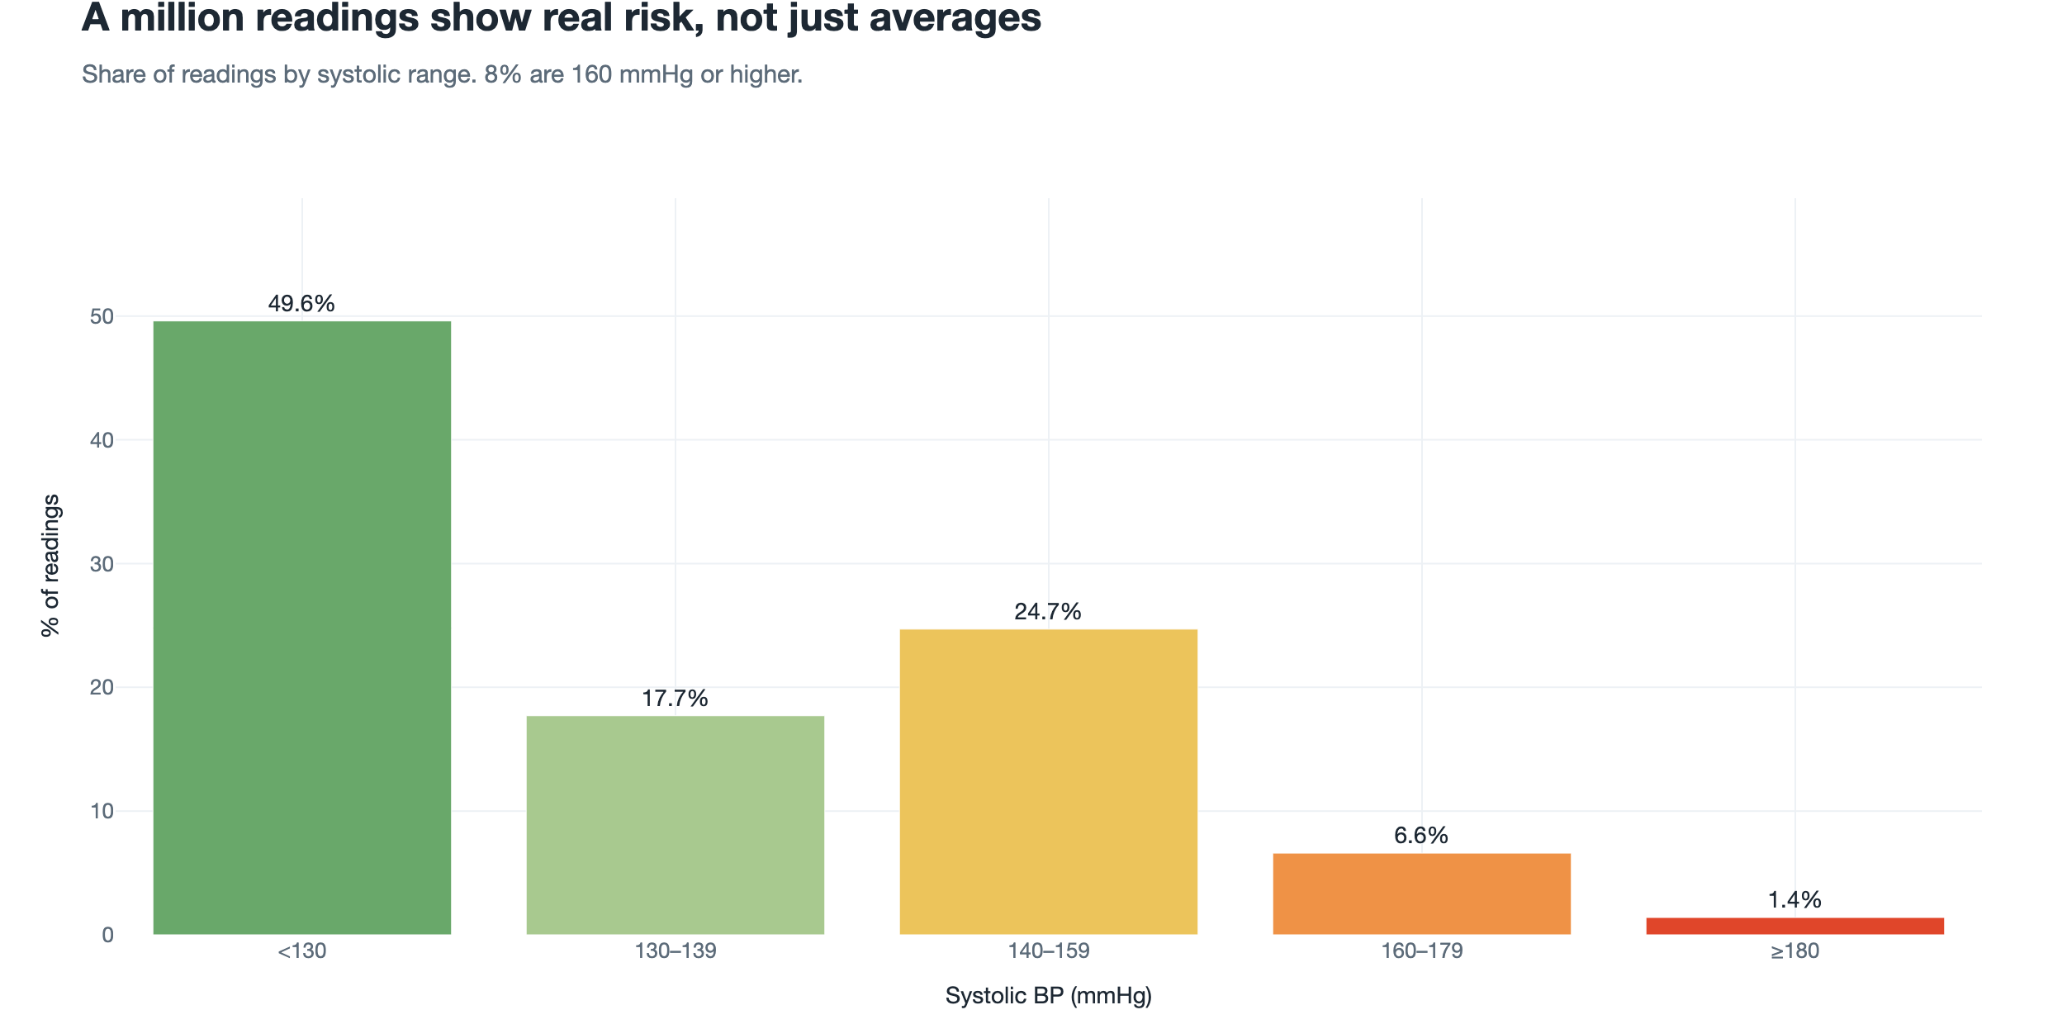
A million readings show real risk, not just nice averages. About 8% of readings had a systolic value of 160 mmHg or higher, and 1.4% had a systolic value of 180 mmHg or higher. These are readings our care teams can review in context.
Where this is going
One million is a milestone, not a finish line. At this pace, two million is already coming into view.
The million is the headline. The real value is what it lets us see.
More readings won't just make the line longer. They'll sharpen what we can see: seasonal patterns, earlier signs of risk, and more complete patient trajectories. This is what remote monitoring should do: turn a flood of measurements into clearer, more honest clinical insight. It also gives us a foundation for exploring predictive models that could help us spot short- and long-term risk earlier.
One million readings and counting. We’re just getting started.
Sources
- Alba BK, Castellani JW, Charkoudian N. “Cold-induced cutaneous vasoconstriction in humans: Function, dysfunction and the distinctly counterproductive.” Experimental Physiology. 2019;104(8):1202–1214. https://pubmed.ncbi.nlm.nih.gov/31045297/